Wageningen University & Research | FEM-31806 | Models for Ecological Systems | FEM | PPS | WEC
CO2Fix - Day 1
Aims
Background information
Start with reading the introduction of mini-Forest as provided in the document Introduction mini-model CO2Fix.pdf on Brightspace. It provides an introduction of the key processes and equations. On Brightspace you will also find a document with only the equations: Mathematical description mini-model CO2Fix.pdf.
The mini-models were derived from published models. The papers describing them are also provided on Brightspace. It is good to read them too. They give an impression of how models can be used.
Conceptual diagram
- The best way to understand and communicate about a model is to develop a conceptual diagram. Such diagrams allow you to represent the modelled system, with all the equations and their interactions and feedbacks. Design first a state-flow-diagram and then a forester-diagram. We recommend to use first pencil and paper to sketch the diagrams with the state variables, rate variables (processes) and auxiliary symbols and insert a picture of your diagrams in a document that you upload later in Brightspace. Alternatively, you are free to use the computer software of your choice to draw the diagrams digitally.
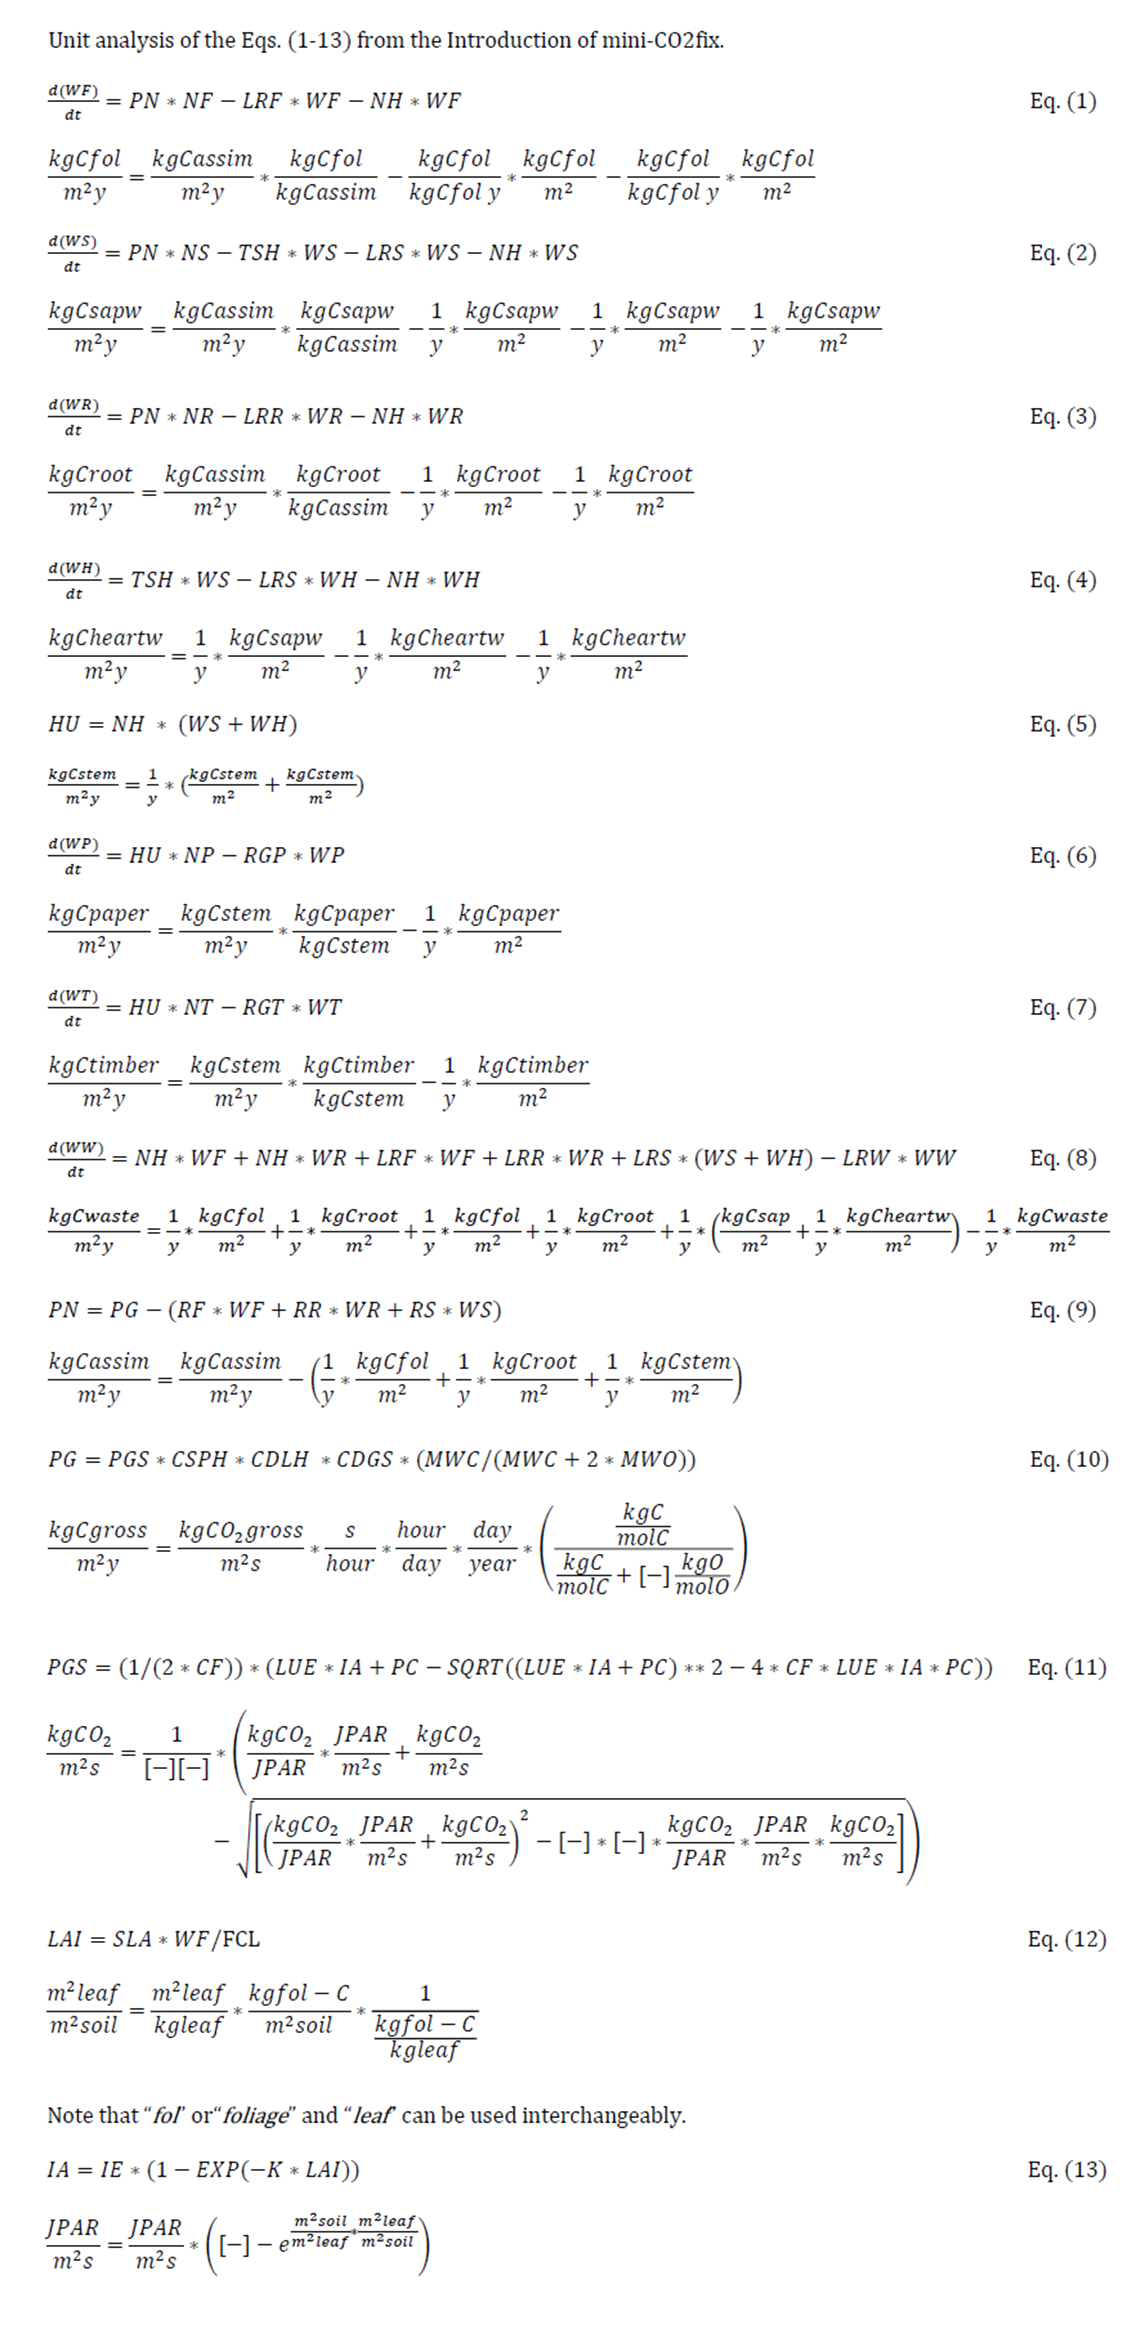
Unit analysis
Perform unit analysis of the model. We recommend to enter the units below every equation and check whether units at the left and right side of the equation are equal. It is recommended to start with auxiliary equations, and then continue with the differential equations. You can directly write these units aligned with the equations in a word document.
Remark: Note that unit analysis is more informative than dimension analysis. In dimension analysis you may for instance refer to length, time and mass. In unit analysis, you would refer to length by (for instance) meters, time by seconds, and mass by grams. Moreover, you better specify the unit analysis by adding the biological, physical or chemical meaning for a variable. For example, we should write for the leaf area index of a vegetation “m2 leaf area m-2 soil”, because this is more informative than only “m2 m-2”, and this improves the model check.
Answers
Conceptual diagram
The conceptual diagrams for this model could look like this:
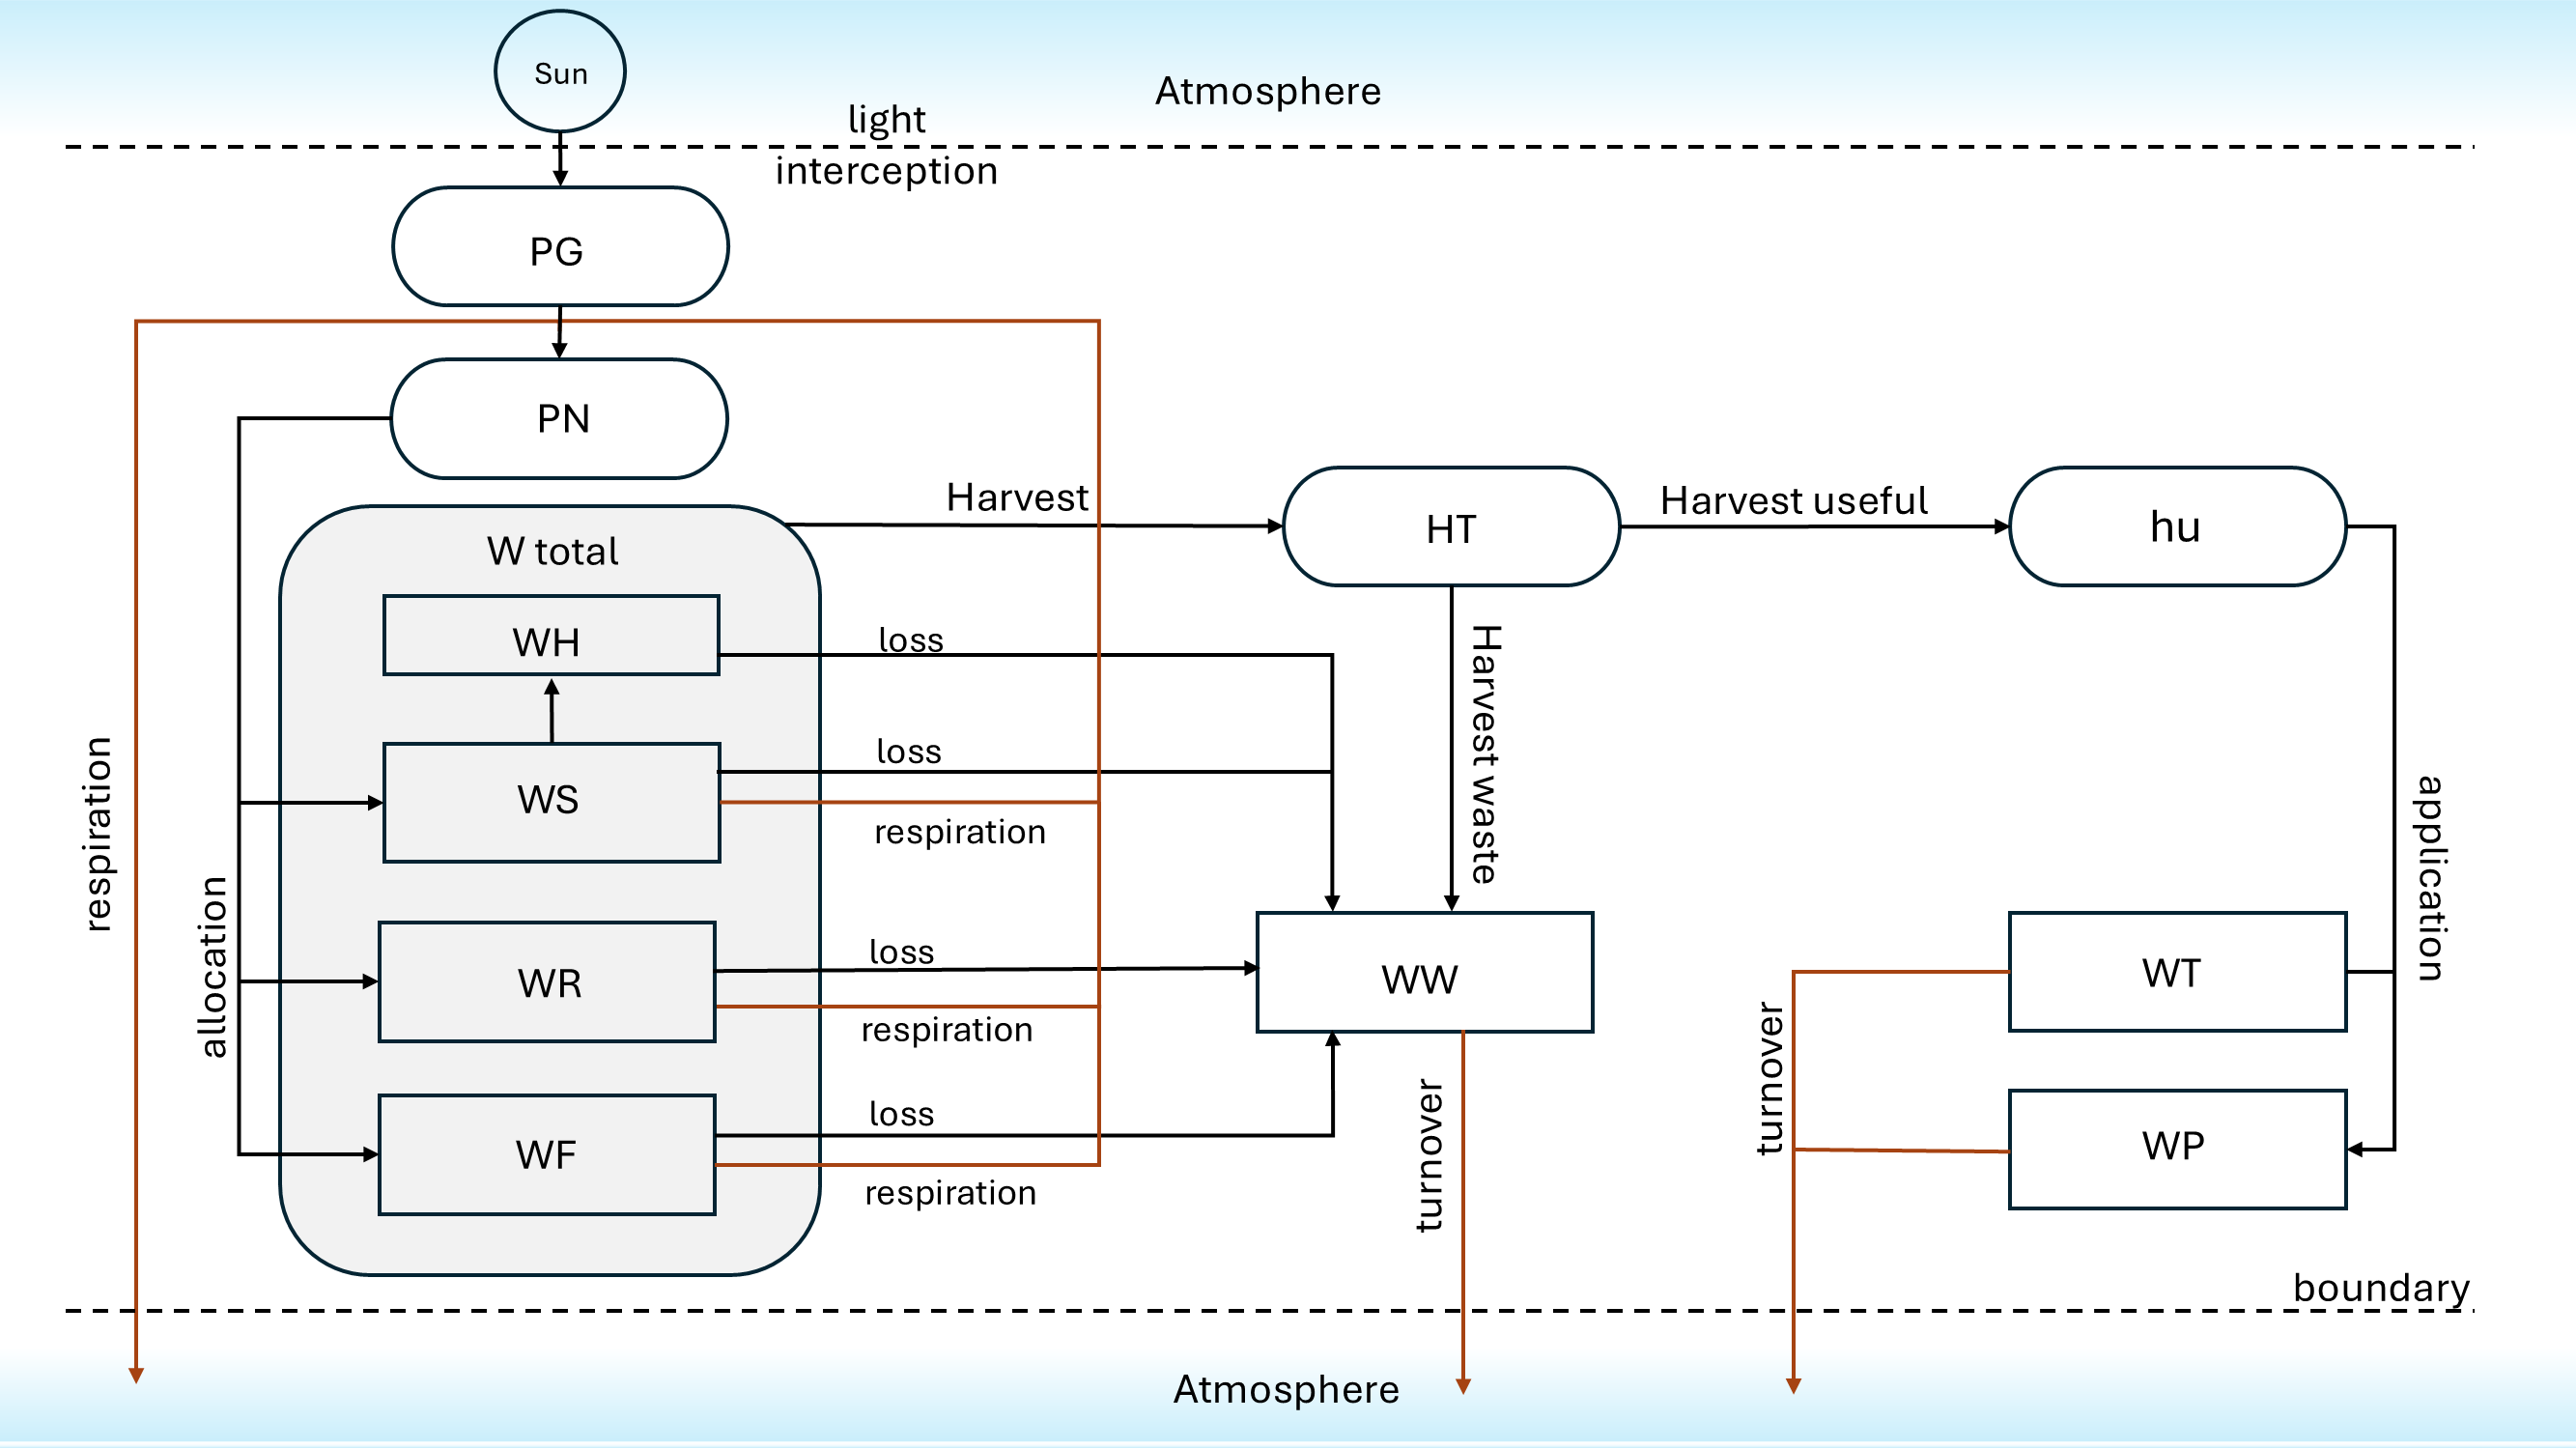
Conceptual mini-model according to a state-flow-diagram. Rectangles are state variables and arrows are flows (i.e. processes).
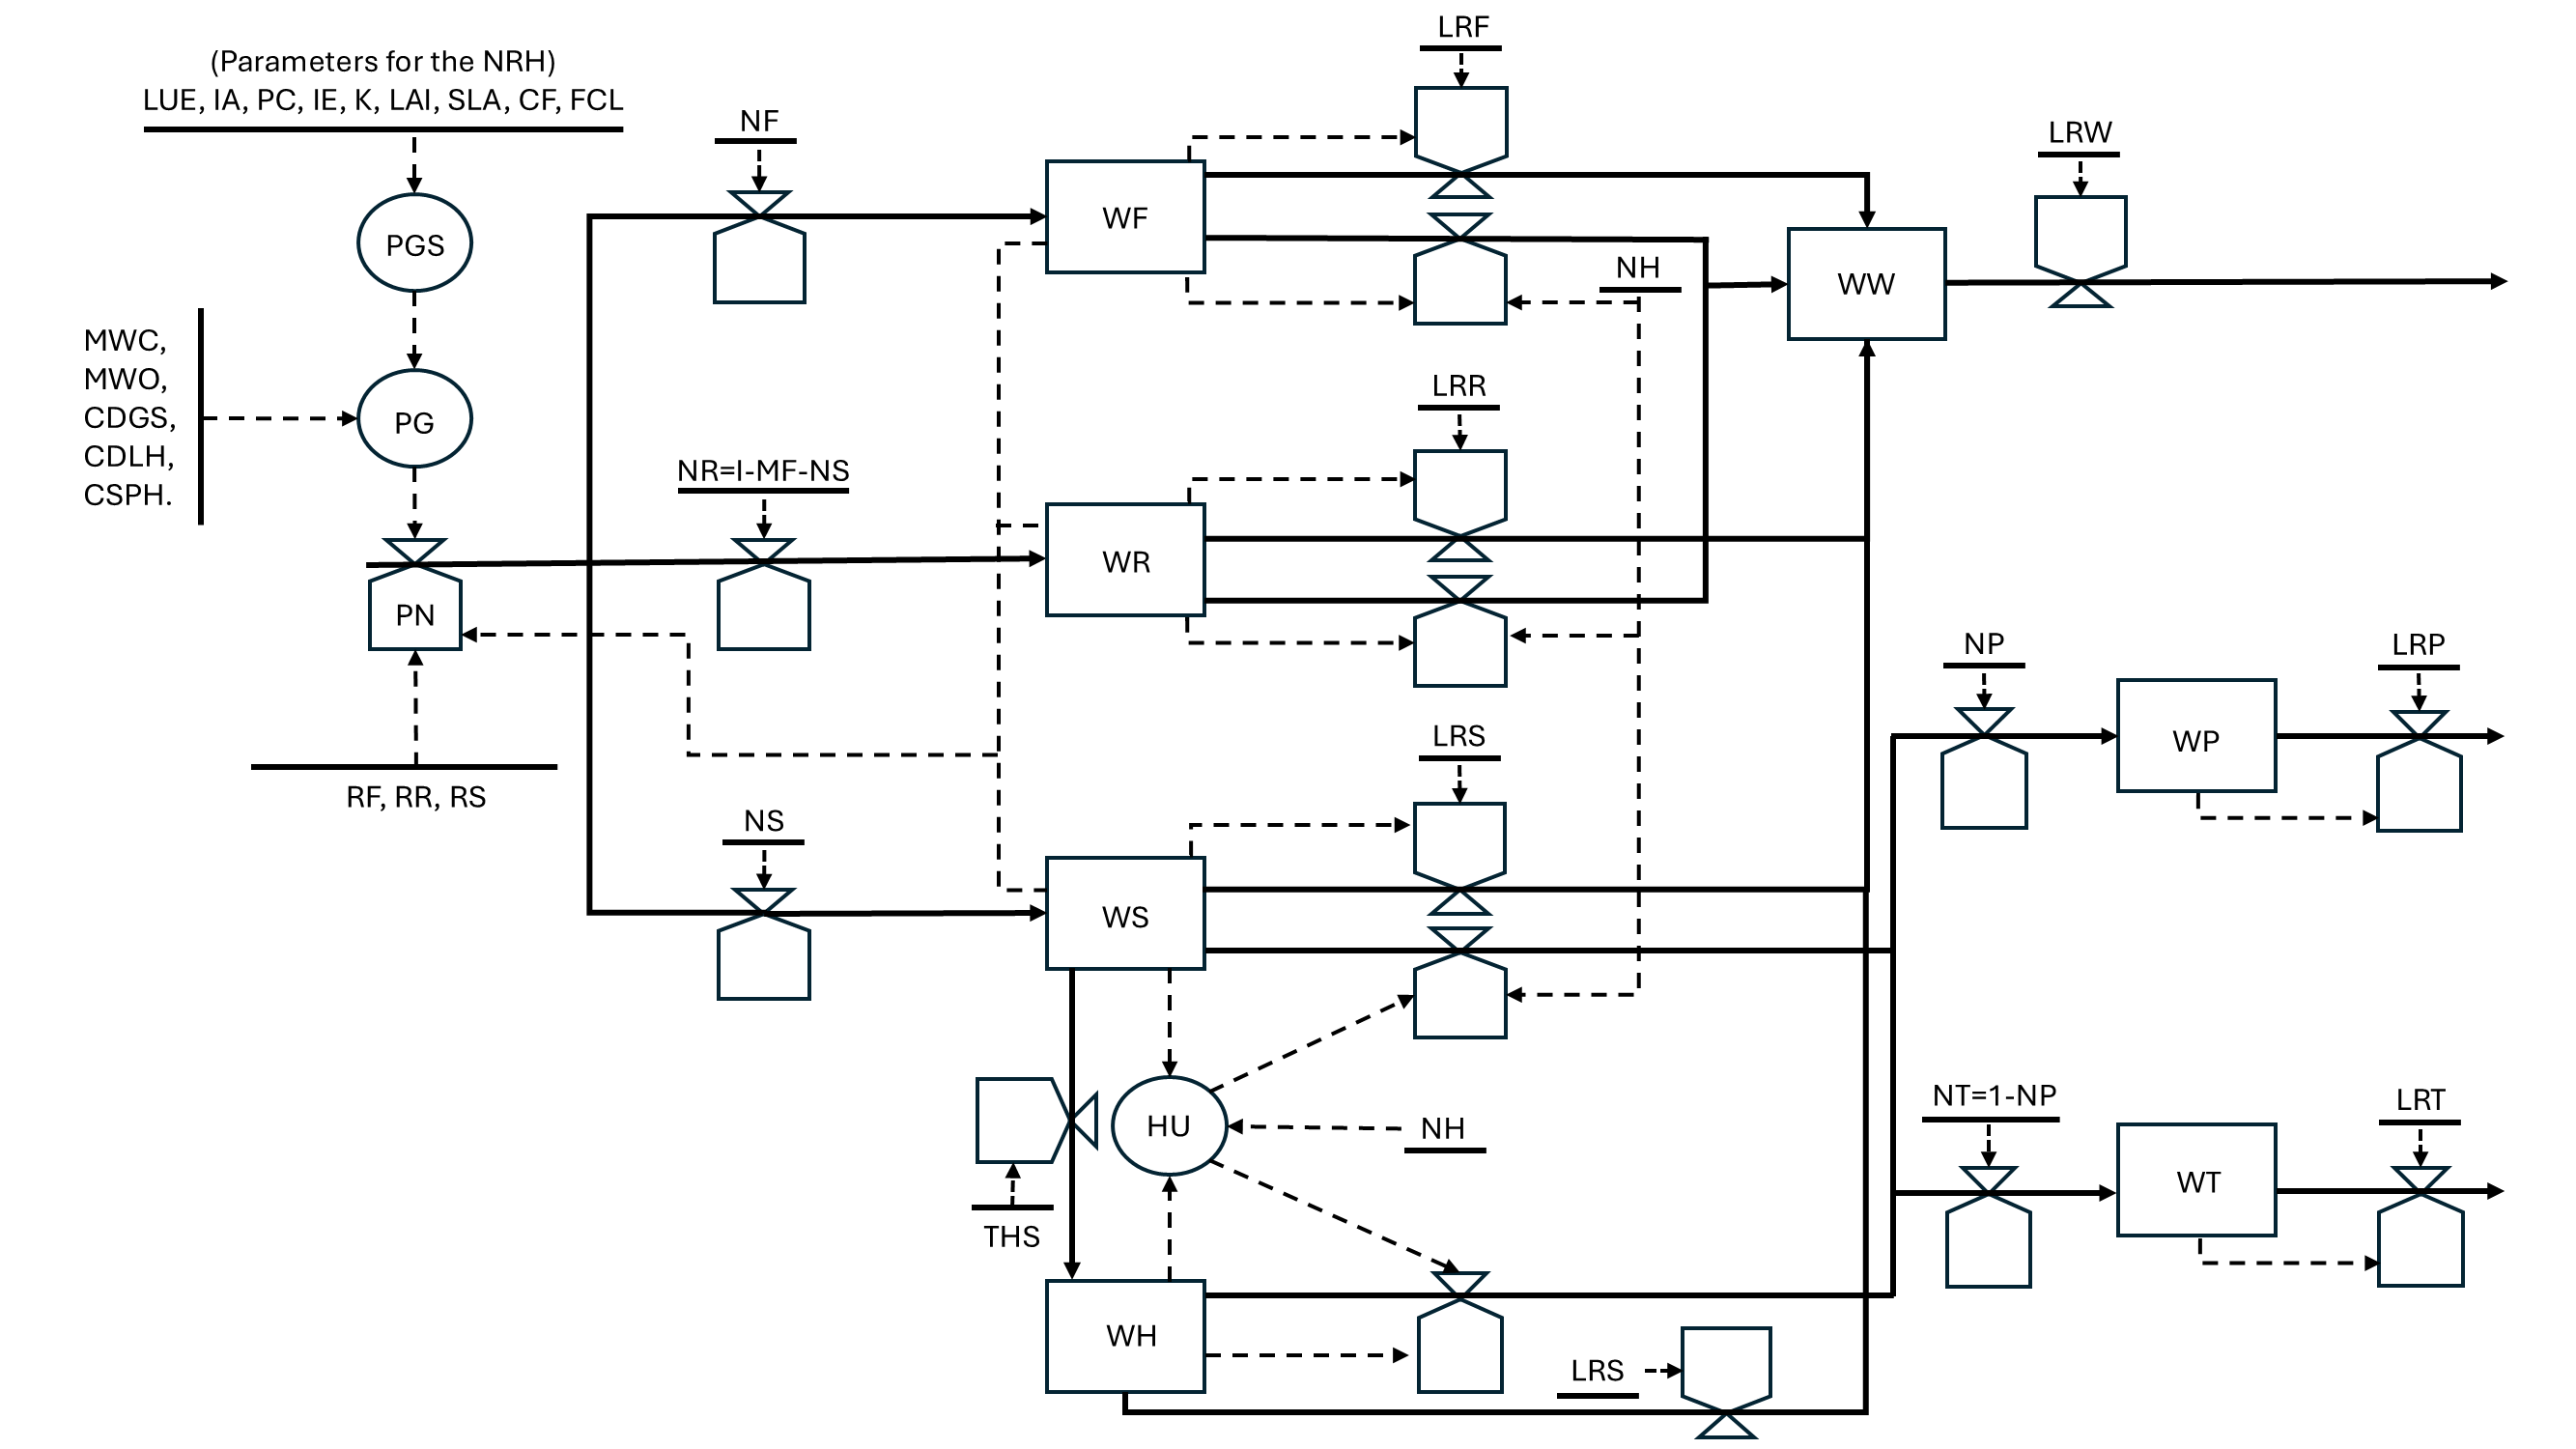
Conceptual mini-model according to Forrester. Rectangles are state variables, circles are auxiliary variables for intermediate calculations, full arrows are material flows and dashed arrows are information flows (See syllabus Chapter 2, Fig. 2.3).
Unit analyses